
The BCG Matrix — short for the Boston Consulting Group Matrix, also called the growth-share matrix is a portfolio management framework that plots a company’s products or business units on two axes: relative market share and market growth rate. That placement sorts every product into one of four categories: Star, Cash Cow, Question Mark, or Dog, each carrying a distinct investment strategy.
It remains one of the most-taught frameworks in business school strategy modules, largely because it answers a question every diversified company eventually faces: which products should we fund, and which should we stop funding? This guide covers the real history behind the framework, breaks down each quadrant with concrete company examples, and shows you how to build and interpret your own matrix — including in our free BCG Matrix generator, which plots your portfolio automatically as you enter it.
What Is the BCG Matrix?
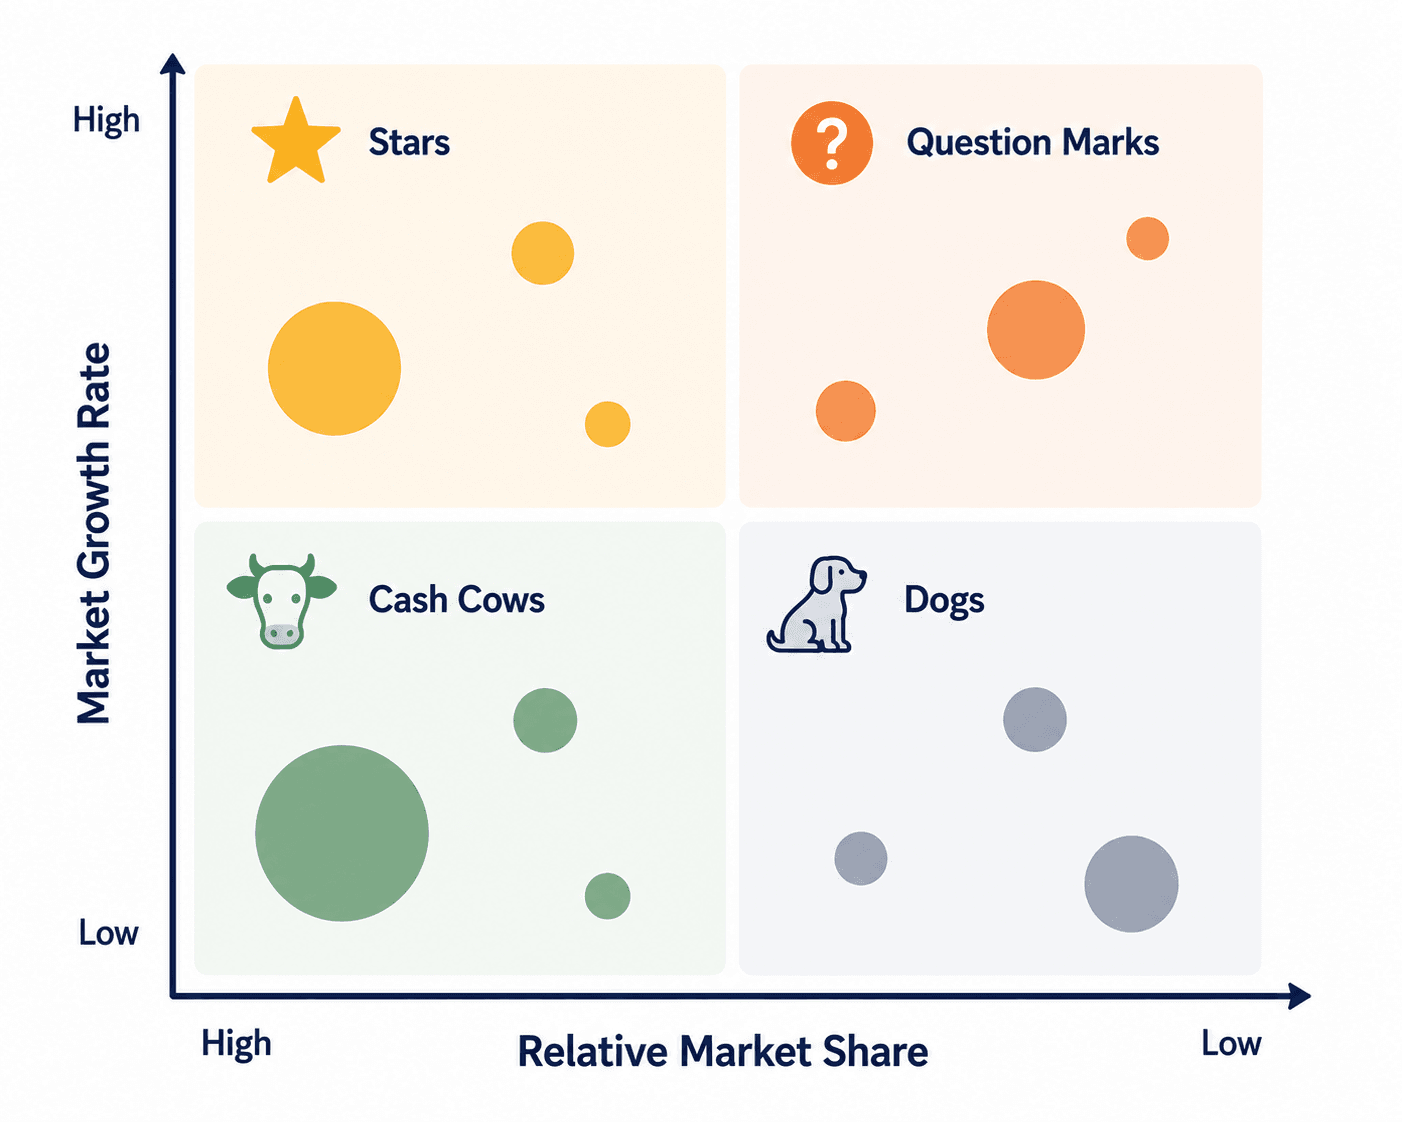
The BCG Matrix definition in its simplest form: a 2×2 grid that classifies business units or products by relative market share (horizontal axis) and market growth rate (vertical axis), producing four quadrants, Stars, Cash Cows, Question Marks, and Dogs.
Each bubble on the chart typically represents one product line or business unit, with bubble size showing revenue or sales volume. The quadrant a bubble lands in tells you, at a glance, whether that unit should receive more investment, less investment, or be sold off entirely.
What makes the BCG Matrix explained properly different from a simple SWOT-style pros-and-cons list is that it’s fundamentally about cash flow across a portfolio, not isolated product performance. A single product’s “goodness” isn’t the point — the point is whether it generates more cash than it consumes, and whether that surplus (or deficit) fits into a balanced overall portfolio.

Who Created the BCG Matrix?
Most articles credit BCG founder Bruce Henderson as the sole inventor. The fuller, more accurate story — confirmed by BCG’s own institutional history — is that the growth-share matrix was a collaborative effort: BCG consultant Alan Zakon, who later became the firm’s CEO, first sketched the concept, and Bruce Henderson then popularized it publicly in his 1970 essay “The Product Portfolio,” published in BCG’s in-house journal, Perspectives.
The framework grew out of a real client problem BCG kept running into after Henderson founded the firm in 1963: the company’s earlier “experience curve” concept worked well for single-product businesses, but most of BCG’s clients were diversified conglomerates running a dozen or more divisions, and the experience curve couldn’t tell a CEO which of those divisions to fund and which to sell. The matrix was the answer — a way to compare unrelated business units on the same two dimensions.
At the height of its popularity in the late 1970s and early 1980s, roughly half of all Fortune 500 companies used the growth-share matrix or an approach based on it, and Harvard Business Review has since named it among the frameworks that changed business strategy. For an academic citation, the safest attribution credits both Zakon (initial concept) and Henderson (1970 publication and popularization) rather than Henderson alone.
The Two Axes: Market Share and Market Growth
Understanding what each axis actually measures — and how to calculate it — is where most students and first-time users get stuck. Neither axis is a raw percentage taken at face value.
| Axis | What It Measures | How to Calculate | What “High” Typically Means |
|---|---|---|---|
| Relative Market Share (horizontal) | Your competitive strength versus the market leader | Your unit’s market share ÷ largest competitor’s market share | A ratio above 1.0 means you are the market leader |
| Market Growth Rate (vertical) | How fast the overall market is expanding | Industry-wide revenue growth rate, typically annualized | Varies by industry — often benchmarked against GDP growth or a fixed threshold like 10% |
The “relative” in relative market share is the detail most people skip. A 20% market share sounds strong until you learn the market leader holds 60% — a relative share of 0.33, which places you firmly on the low-share side of the matrix regardless of how large 20% sounds in isolation.
The Four Quadrants Explained
Once a product is plotted, it falls into one of four categories. Each one implies a different cash flow profile and a different strategic response.
| Quadrant | Market Share | Market Growth | Cash Flow Profile | Typical Strategy |
|---|---|---|---|---|
| ⭐ Star | High | High | Neutral to negative — consumes cash to maintain growth | Invest to defend or grow market leadership |
| 🐄 Cash Cow | High | Low | Strongly positive — the portfolio’s profit engine | Harvest profits; minimal reinvestment needed |
| ❓ Question Mark | Low | High | Negative — consumes cash with uncertain return | Invest selectively to build share, or divest |
| 🐕 Dog | Low | Low | Breakeven or slightly negative | Divest, reposition, or hold only for strategic synergy |
BCG Matrix Cash Cow: Why This Quadrant Matters Most
Of the four quadrants, “Cash Cow” generates the most search interest and the most confusion, so it’s worth isolating. A BCG Matrix Cash Cow is a product or business unit with high relative market share in a slow-growth or mature market, think Google Search, or the iPhone within Apple’s broader hardware lineup.
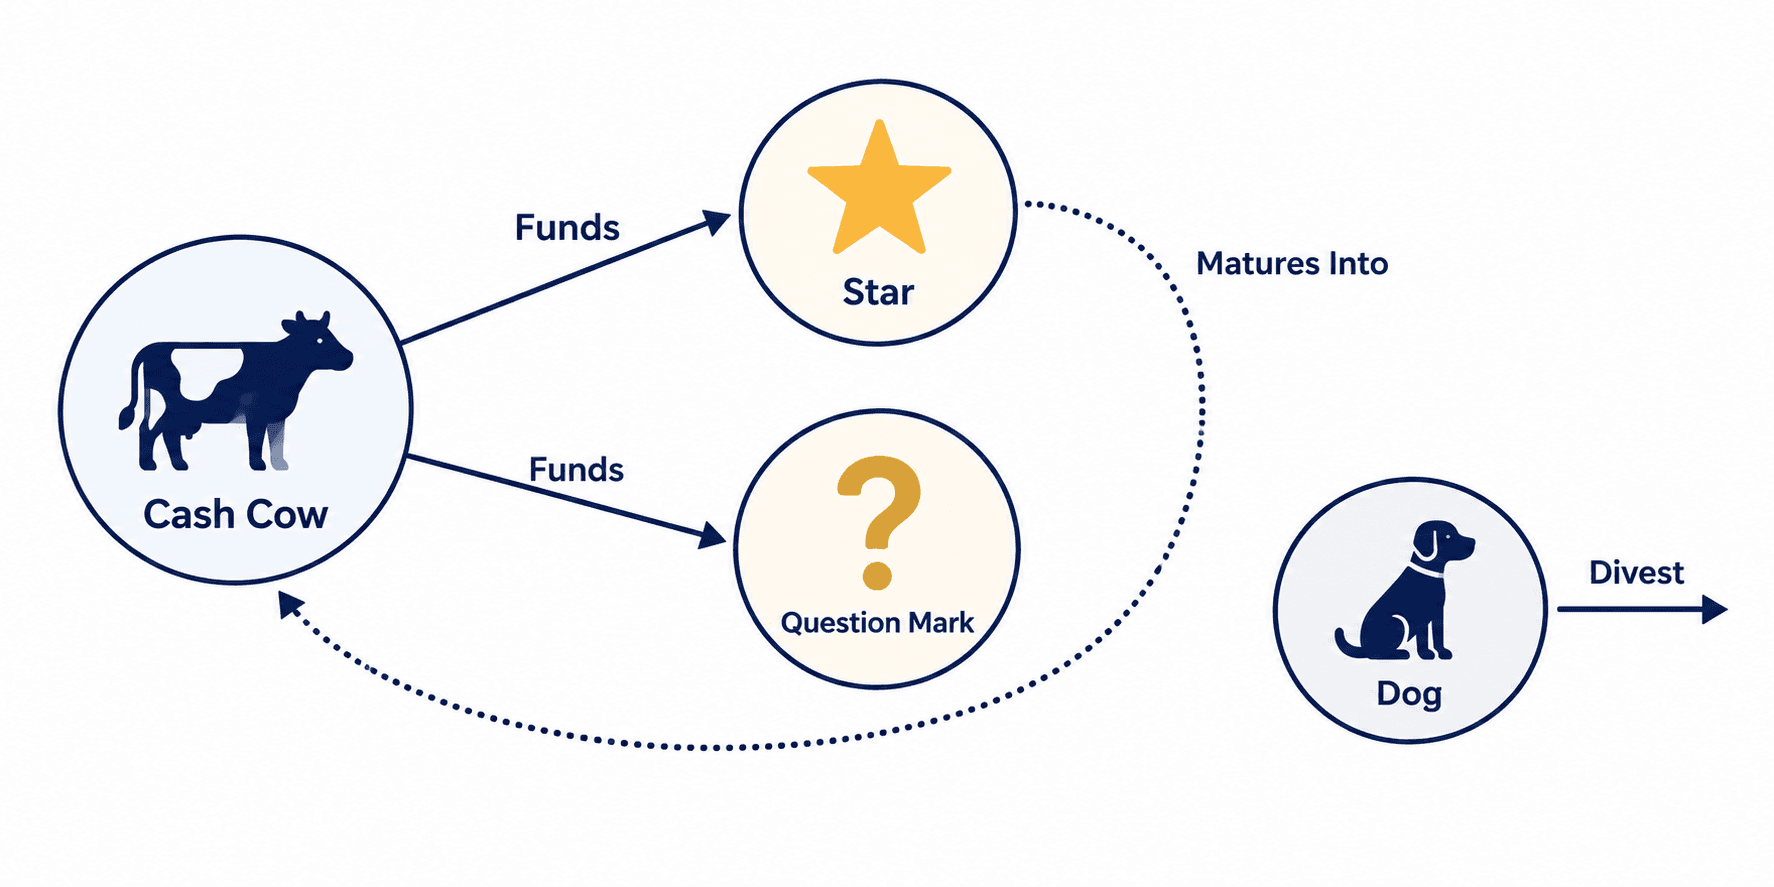
Because the market is no longer expanding quickly, a Cash Cow doesn’t need heavy reinvestment to defend its position. That’s precisely what makes it valuable: the surplus cash it generates funds the units that do need investment, Stars defending their lead, and Question Marks trying to earn one.
| Signal | Cash Cow | Star (Often Confused With) |
|---|---|---|
| Market growth | Low / mature market | High / expanding market |
| Investment needed | Minimal | Substantial, ongoing |
| Net cash flow | Strongly positive | Often neutral or negative |
| Strategic risk | Low — position is defensible | Higher — competitors are actively contesting share |
A useful mental model, and one worth citing directly in a case study: Stars are tomorrow’s Cash Cows. As a Star’s market matures and growth slows, a well-defended leadership position converts it into a Cash Cow — which is exactly what analysts have watched happen with AWS inside Amazon’s portfolio over the past several years.
How to Build a BCG Matrix: Step by Step
| Step | What to Do | Common Pitfall |
|---|---|---|
| 1. Define your portfolio scope | List the specific products, brands, or business units you’re analyzing. | Mixing units at different levels (a whole division next to a single SKU) distorts the comparison. |
| 2. Calculate relative market share | Divide each unit’s market share by the largest competitor’s share. | Using absolute market share instead of relative share. |
| 3. Determine market growth rate | Find the annual growth rate of the overall market each unit competes in — not the unit’s own revenue growth. | Confusing company growth with market growth; they aren’t the same number. |
| 4. Set your thresholds | Decide what counts as “high” share (often a 1.0 relative-share ratio) and “high” growth (often 10%, but industry-dependent). | Applying a generic threshold to a niche or highly cyclical industry. |
| 5. Plot each unit as a bubble | Position by share and growth; size the bubble by revenue or sales volume. | Sizing bubbles by profit instead of revenue, which skews the cash-flow read. |
| 6. Interpret quadrant balance | Check whether the portfolio has enough Cash Cows to fund its Stars and Question Marks. | Treating the matrix as a final decision rather than a starting point for deeper analysis. |

Real BCG Matrix Examples: Apple, Google, Amazon
Abstract quadrant definitions are easier to apply once you’ve seen them mapped onto real, recognizable portfolios. These are illustrative classifications based on publicly known market positioning, not each company’s internal strategic documents.
| Company | ⭐ Star | 🐄 Cash Cow | ❓ Question Mark | 🐕 Dog |
|---|---|---|---|---|
| Google / Alphabet | Google Cloud — fast-growing market, third-largest player | Google Search — dominant global share in a mature market | Waymo — high-growth autonomous vehicle market, unclear monetization | Google+ (discontinued) — never achieved meaningful share |
| Amazon | Amazon Ads — fast-growing, high-margin advertising platform | AWS — transitioning from Star to Cash Cow as cloud growth matures | Alexa / Echo — pioneering position, struggling to monetize | Physical bookstores — reopened, then closed; minimal share, no growth |
This kind of applied, company-specific breakdown is exactly what our BCG Matrix generator is built around — it ships with pre-loaded templates for a Tech Giant, an FMCG portfolio, a Retail Group, and several other common assignment scenarios, so you can start from a realistic example instead of a blank grid.
Strategic Actions by Quadrant
Classifying a product is only half the exercise. The framework’s real value is the investment decision each quadrant implies.
| Quadrant | Strategic Action | Investment Level |
|---|---|---|
| Star | Invest to hold or grow share; defend against new entrants | High |
| Cash Cow | Harvest profits; fund Stars and Question Marks with the surplus | Low |
| Question Mark | Invest selectively toward Star status, or divest if leadership looks unreachable | Variable, case-by-case |
| Dog | Divest or reposition, unless retained for strategic synergy elsewhere in the portfolio | Minimal |
BCG Matrix vs. SWOT, PESTLE, and Porter’s Five Forces
The BCG Matrix is rarely used alone in a well-built assignment or strategy deck. It answers one specific question — where should we allocate capital across our portfolio? — and other frameworks fill in what it deliberately leaves out.
| Framework | Core Question | Scope | Works Well Paired With BCG? |
|---|---|---|---|
| BCG Matrix | Which products deserve investment, and which should we cut? | Portfolio-level, two dimensions | — |
| SWOT | What are our internal strengths/weaknesses and external opportunities/threats? | Single business or product, four dimensions | Yes — Stars and Cash Cows often become Strengths; Dogs and Question Marks often surface as Weaknesses or Threats |
| PESTLE | What macro-environment forces affect the whole market? | External only, six dimensions | Yes — explains why a market’s growth rate is shifting in the first place |
| Porter’s Five Forces | How competitive and profitable is this industry structurally? | Industry-level, five competitive forces | Yes — explains why a market share position is defensible or fragile |
If your assignment requires the full strategic picture rather than the portfolio view alone, our guide on how to do a SWOT analysis for a business assignment shows how to translate BCG quadrant findings directly into Strengths and Threats. For the external market conditions driving your growth-rate axis, see our PESTLE analysis generator guide, and for a deeper explanation of PESTLE’s academic application, the guest piece on PESTLE analysis meaning in strategic management is a useful companion read. If competitive intensity within a specific quadrant needs more scrutiny, particularly for Question Marks and contested Stars — Porter’s Five Forces, covered in this academic guide, is the standard next step.
Limitations of the BCG Matrix
No framework this simple survives fifty years of use without well-documented weaknesses. Citing these honestly is exactly what separates a strong academic critique section from a purely descriptive one.
| Limitation | Why It Matters |
|---|---|
| Only two dimensions | Ignores brand strength, technology risk, synergies between units, and other factors that affect real investment decisions |
| Subjective thresholds | What counts as “high growth” or “high share” varies by industry and is set somewhat arbitrarily |
| Ignores synergies | A Dog that supports a Cash Cow’s supply chain may be strategically necessary despite weak standalone numbers |
| Market share ≠ profitability | High share doesn’t automatically guarantee strong margins, especially in commoditized markets |
| Static snapshot | The matrix reflects one point in time; fast-moving markets can shift a unit’s quadrant within a year |
These limitations are precisely why the BCG Matrix works best as a first-pass screening tool, not a standalone decision-making system — pairing it with a Business Model Canvas fills in the operational detail the matrix doesn’t capture. Our guide on how to write a Business Model Canvas for a university assignment covers that companion framework step by step.
Common Mistakes When Building a BCG Matrix
| Mistake | Fix |
|---|---|
| Using absolute market share instead of relative share | Always divide by the largest competitor’s share, not by total market size |
| Confusing company revenue growth with market growth | The vertical axis measures the market’s growth rate, not the unit’s own sales trend |
| Treating every Dog as an automatic sell | Check for strategic synergy or brand-continuity value before recommending divestiture |
| Applying one growth threshold across unrelated industries | Calibrate “high growth” to the specific market each unit competes in |
| Stopping at classification without a recommendation | Every quadrant placement should end in an investment decision, not just a label |
Free BCG Matrix Generator
Manually building a bubble chart with correctly scaled axes in PowerPoint or Excel is where most of the time in a BCG Matrix assignment actually goes. Our free BCG Matrix generator handles the plotting for you.
Add each product or business unit, set its relative market share and market growth rate using simple sliders, and the bubble plots — and its quadrant classification — updates instantly. A few practical details:
- Six ready-made portfolio templates (Tech Giant, FMCG, Media Company, Retail Group, Pharma Portfolio, Auto Manufacturer) give you a realistic starting point instead of a blank canvas.
- Bubble size scales with revenue or sales volume, matching standard BCG Matrix chart conventions.
- Pro Mode adds a Strategy Tips panel that names your Stars, Cash Cows, Question Marks, and Dogs directly and recommends an investment action for each.
- Export as a high-resolution PNG for a slide deck or report — no signup, and nothing is uploaded to a server.
Frequently Asked Questions
What is the BCG Matrix?
The BCG Matrix is a strategic portfolio framework developed at the Boston Consulting Group and popularized in 1970. It plots products or business units on two axes relative market share and market growth rate — classifying each into one of four categories: Stars, Cash Cows, Question Marks, and Dogs.
What are the four BCG Matrix quadrants?
Stars (high share, high growth invest to maintain leadership), Cash Cows (high share, low growth — harvest profits), Question Marks (low share, high growth invest selectively or divest), and Dogs (low share, low growth — divest or reposition).
Who created the BCG Matrix?
BCG consultant Alan Zakon first sketched the concept; BCG founder Bruce Henderson popularized it publicly in his 1970 essay “The Product Portfolio.” Crediting Henderson alone, as many sources do, omits Zakon’s originating role.
What is a BCG Matrix Cash Cow?
A product or business unit with high relative market share in a slow-growth, mature market. It generates more cash than it needs for reinvestment, and that surplus typically funds Stars and Question Marks elsewhere in the portfolio. Google Search and the iPhone are commonly cited examples.
How do you calculate relative market share?
Divide your unit’s market share by the market share of your largest competitor. A result above 1.0 means you are the market leader; below 1.0 means a competitor holds more share than you do.
What are examples of the BCG Matrix in practice?
Apple’s iPhone functions as a Cash Cow, its Apple Watch as a Star, and Apple TV+ as a Question Mark. Google Search is a Cash Cow, Google Cloud is a Star, and Waymo is a Question Mark. These are illustrative classifications based on public market positioning.
What are the limitations of the BCG Matrix?
It relies on only two dimensions, uses subjective growth and share thresholds, ignores synergies between business units, and treats market share as a stand-in for profitability, which isn’t always accurate. It works best combined with frameworks like SWOT, PESTLE, or Porter’s Five Forces.
Is the BCG Matrix generator free to use?
Yes. The BCG Matrix generator is completely free, requires no signup, and your data is saved only in your browser.
Conclusion: Key Takeaways
The BCG Matrix earns its place in nearly every strategy curriculum because it forces a specific, useful question: given a portfolio of products competing for the same limited capital, which ones should get funded, and which ones should be cut loose?
- The two axes are relative market share (versus the largest competitor) and market growth rate — not raw, absolute numbers.
- Stars need investment, Cash Cows fund the rest of the portfolio, Question Marks are the genuine strategic bets, and Dogs are usually candidates for divestiture.
- The framework’s real origin credits both Alan Zakon (initial concept) and Bruce Henderson (1970 publication), not Henderson alone.
- It works best paired with SWOT, PESTLE, or Porter’s Five Forces, since it deliberately leaves out competitive dynamics and macro-environment factors.
- You can build, classify, and export your own matrix in minutes with the free BCG Matrix generator — no signup, no cost, nothing sent to a server.
Read Also: